Spring Break Herp Style


group at night 1“This is not a Spring Break trip to Costa Rica, it is a herpetology class trip to Costa Rica that happens to be over Spring Break.” So said Jonathan Losos to a room full of eager students, many of whom had chosen to take Herpetology in part because of the adventure that awaited them. As first year Ph.D. students in the Losos lab, we were as excited as anyone for the opportunity to see some of Costa Rica’s rich biological diversity. Plus the well-publicized stereotype of how young people spend Spring Break has never really appealed to us. We’d rather be in the nighttime forest with a headlamp.

Anolis pentaprion 1

The lichen anole, A. pentaprion

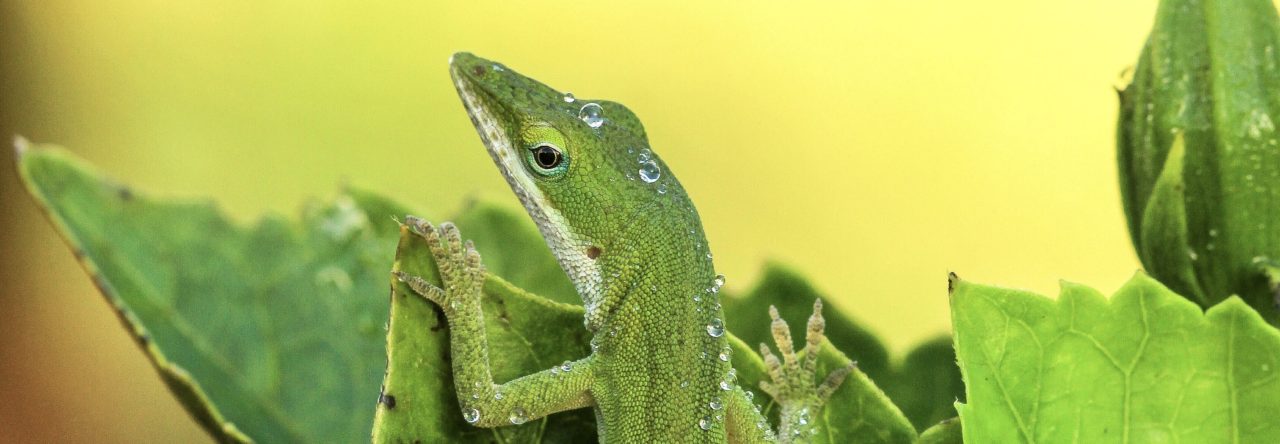
The trip started with a day and a half at Veragua Rainforest. We saw tons of frogs and a handful of snakes, but anoles were hard to come by except for a few individuals along shallow, slow-moving streams (A. humilis, A. limifrons, and A. oxylophus). One of our most exciting finds of the trip was along one of these streams – an A. pentaprion hugging a narrow stem at eye level. It was shocking to see this lizard so close to the ground as it is often found high in the canopy and has even been observed gliding between perches. While many mainland anoles don’t fall clearly into the classic ecomorph categories, this lizard, with its small legs, long body and head, and slow but sneaky evasive behavior, is very reminiscent of West Indian twig anoles (and he’s got a gorgeous dewlap too! see photo at end of post).

From Veragua we moved to La Selva Biological Station where we spent five action-packed days exploring the forest and documenting the herpetofauna.

Anoles of Culebra

I am very interested in IDing the following anoles I saw on the island of Culebra, which is 17 miles east of Puerto Rico. I thought I would be able to find a guide to anoles of this area online, but IDing them turned out to be harder than I thought. Thank you for your time!
1) First one was found in the parking lot of Flamenco.
Flamenco, Culebra

2) Also found near Flamenco.
Anole, Flaminco 2

3) Found in town. Bright yellow dewlap.
Anole, Culebra 4

4) Found in town.
Anole, Culebra

5) Found in town.
Anole, Culebra 2

6) Found in town. Dewlap was dark orange with yellow near the throat.

Anole, Culebra 3

Anole March Madness: Sweet 16 Round Complete!

Anole MM16

Our (fictional) tournament of anoles is well underway as we complete the Sweet 16 round! The competition was tough and a few favorites fell from glory (sorry!). We’ve been repeatedly asked how the competitions are being decided. We are not rolling dice or using random outcome generators. For each match, we (K. Winchell, M. Muñoz, and P. Muralidhar) are reading up on the biology of the species involved and we debate what would happen if they were to meet each other and try to highlight some facts about each. In cases where we might be biased we step aside and let the others decide. If it were up to me of course, Anolis cristatellus would be in the final! (Really, they’re scrappy and mean little guys!)

And now the results!

How Different Do Two Different Colors Look? Ask an Anole

In trying to understand the evolution of visual signal diversity we are often faced with problem of asking which of two possible signals is most visible against a particular natural background. Alternatively we may want to know how easily different signals (for example signals of sympatric species) can be told apart.

When animals use colorful signals to communicate with conspecifics, selection will tend to favor colors that are highly visible against the natural background and colors that can easily and unambiguously be distinguished from signals utilized by other similar-looking species. Thus, in order to understand the evolutionary pressures on signal properties, we often want to know how distinct two different colors appear to an animal viewer. Perception of color by most animals differs from human perception because of differences in visual-system anatomy and physiology. How, then, can we quantify the difference in appearance of colors to an animal viewer?

A useful approach is to quantify the perceived difference between color stimuli as a distance in the animal’s “perceptual color space.” This refers to some measure of the difference in sensory stimulation elicited by different colors. At present most studies of visual ecology and communication use one of two methods to measure perceptual color space distance between pairs of colors. The first involves determining the relative stimulation of the different classes of cone photoreceptors by each color stimulus in units of relative photon capture, plotting colors in n-dimensional space (where n is the number of photoreceptor classes), and then measuring a simple Euclidian distance between the points. The second approach involves estimating the noise within each photoreceptor channel, determining the detection threshold – defined as the just-noticeable difference, or JND, between the two colors – determined by photoreceptor noise, and then estimating the distance between two colors in units of multiples of this threshold, or in units of JNDs. The photoreceptor noise method has been shown to be effective for estimating color discrimination thresholds, but the idea that differences between supra-threshold colors can be measured in multiples of the JND is more controversial. Each of these methods has some theoretical support, and each has advantages and disadvantages in terms of assumptions required and the information needed to do the calculations. However, empirical tests of which method works best are lacking, and there is not much agreement on the best way to measure perceived differences between colors that are well beyond the threshold for discrimination.

What we need here is a model system – and that usually means anoles! Anoles have an excellent, well-understood color vision system. Moreover a method has been developed that uses visual attention as an assay of signal visibility. Fleishman et al. (2016) used this method to quantify the visibility of different colors viewed against a gray background by Anolis sagrei. They then used these behavioral results to test the accuracy of the two different popular methods of measuring distance in visual color space. In these experiments anoles viewed a checkerboard of gray squares in their visual periphery (Fig. 1). One square was then abruptly shifted to some other color. The distance in color space from the initial gray to the newly appearing color was determined using the two different metrics described above. The probability of a gaze shift towards the novel colored stimulus was quantified, and colors throughout the anoline color space were tested. The probability of detection was then plotted against the different measures of perceptual color distance.

anole_annal_fig1

Figure 1. (a) Lizard sits on the perch in a small cage. The experiment waits until its gaze is directed straight outward towards the video camera (t1). At t2 a small colored stimulus square is presented in the middle of the checkerboard visual field. The camera records whether or not the lizard notices the newly introduced color-square and shifts its gaze towards it. See the video above. The video at the top of the page illustrates the appearance of the stimulus to a lizard and shows a positive response.

Which method best predicted the results? It turns out both methods gave excellent predictions of the behavioral data! In this case anoles are the peacemakers. Basically, the information available to the color vision system is how much difference there is in the photon capture by different cone classes exposed to different colors. These two different ways of quantifying this change turn out to give rather similar predictions, and both sets of predictions accurately predict detection probability. Thus the anoles give a firm go ahead for both methods of modeling distance in color space. The ability to easily model distances between colors in anoline perceptual color space should greatly facilitate studies of the evolution of dewlap color diversity because we can easily figure out which color is most visible under each set of natural habitat light conditions.

Now we just have to figure out why Anolis dewlaps come in so many different colors!


Is There a Crisis in Anolis Taxonomy?

A few days ago, I had a very interesting discussion in twitter with some colleagues (see here [1] and here [2]) about whether there is a decline and crisis of new taxonomists in amphibians and reptiles. I wonder if this situation might be the case fir Anolis lizards, or whether Anolis has its own tendency in species description. So, I decided to take the bull by the horns and I went to the Uetz Reptilia Database to see the numbers.

First, it seems that there is not an increase in species description for anoles across time. In early years, it was a bunch of new descriptions as also recently (Fig 1).

Figure1

However, if you check how many anole taxonomists have described species, an interesting pattern emerges. Very few people have described almost all of anole diversity (Table 1). Only 15 anologists have described all currently known species (400 according to the Uetz database), and more interesting is the fact that only five of them are still alive! (Gunther Köhler, Orlando Garrido, James McCraine, Steven Poe and Larry Wilson; Table 1).

Table 1. Ranking of anole taxonomists by number of species described.

Table 1. Ranking of anole taxonomists by number of species described.

Then, to establish if new authors (new anole taxonomists) are emerging in recent times, I made an accumulation curve of authors across years of description (Fig. 2). I considered only the senior author (Fig. 2, top) and all authors involved in the description  (Fig. 2, bottom). From these figures, it is possible to see, apparently, that very few new authors are emerging as anole taxonomist specialists.

Accumulation of authors by year. Only senior author (top), all authors involved in the description (bottom)

Accumulation of authors by year. Only senior author (top), all authors involved in the description (bottom)

This suggests, at least to me, that something is happening in anole taxonomy. As we discussed in twitter, this scarcity in taxonomists in recent times could be due to several factors: lack of interest in describing new forms, lack of funding resources, lack of access to comparative material (i.e., herpetological collections), lack of writing skills to generate scientific papers, or lack of adequate taxonomic training. In any case, I feel that anole taxonomy would be in crisis if new people, mostly from Latin America, are not interested in describing and revising new species in each country. But, why are very few people seem to be interested in describing new valid species nowadays? Is it perhaps that taxonomy is a discipline with little interest in academia? Does doing so serve to get a job? Is it not worth publishing papers in taxonomy or even describing new forms?

Although today there are a bunch of journals oriented to taxonomy and many online resources to access to primary literature (Sci-Hub [3], BHL[4], etc.), it seems that very few people are interested to tackle these problems in our iconic lizards.

I would like to see your opinions on this

References

[1] https://twitter.com/CrawfordAJ/status/713398834005561344

[2] https://twitter.com/CrawfordAJ/status/713459231983280130

[3] https://en.wikipedia.org/wiki/Sci-Hub

[4] http://www.biodiversitylibrary.org

City Slickers: Performance and Substrate Properties in Urban Anoles

Anolis cristatellus on a smooth, vertical substrate in Puerto Rico (photo by K. Winchell)

Anolis cristatellus on a smooth, vertical substrate in Puerto Rico (photo by K. Winchell)

In urban areas, the number of natural substrates (e.g. trees) is reduced. In their place are novel manmade substrates (e.g. walls, metal gates). These surfaces undoubtedly have different properties relevant to anole locomotion: they are smoother, harder, and (in the case of walls) much broader and flatter compared to natural surfaces in a forest. In urban areas lizards still use these substrates at high frequency, but do they do so effectively? Kolbe and co-authors began to dive into this complex topic in their recent publication, “City slickers: poor performance does not deter Anolis lizards from using artificial substrates in human-modified habitats” (Kolbe et al. 2015).

The relationship between habitat use, morphology, and performance for anoles has been extensively studied in natural environments (reviewed in Losos 2009). Urban environments add new dimensions to this area of research. Resource distribution and abundances differ drastically compared to natural areas. For example, the distribution of available perches and what they are made of in urban habitats is very different from a forest. Moreover, the properties of these resources differ drastically as well: urban substrates are smoother, broader, and have different thermal properties, to start. Understanding these differences in habitat use and how they influence performance and, ultimately, adaptive responses in anoles is the topic of ongoing collaborative research that I (K. Winchell) and the Kolbe lab  have been conducting.

Anole March Madness: Round 1 Complete!

Anole MM16

If you’ve been following along with our “Anole March Madness” tournament and you didn’t catch the updates on Twitter, you’re in luck. Here are the recaps of the second half of the Round of 32.

And of course, we remind our readers that these battles are fictional and are meant to highlight ecology, distribution, and traits of some well-known and not-so-well-known anoles. All battles are written by myself (K. Winchell), Martha Muñoz, and Pavitra Muralidhar using “complex algorithms” to determine the ultimate champion.

The next round (Sweet 16) kicks off on Twitter March 28 at 8pm. Follow along live and tag your comments #AnoleMM2016! Also next week we will be highlighting the “state of the knowledge” about the anoles featured in our tournament. Any guesses (no cheating) which species has the most citations and which has the least? We’ll give you the run-down of what we know and don’t know about who.

And here’s the recap of the second half of the Round of 32!

Download Skip Lazell’s 1972 Monograph on the Anoles of the Lesser Antilles

From Skip Lazell's 1972 monograph

From Skip Lazell’s 1972 monograph

Like many other biodiversity journals, the contents of the Bulletin of the Museum of Comparative Zoology are available on the Biodiversity Heritage Library. However, the BHL can be somewhat cumbersome to deal with, if not downright counterintuitive. Just today, I downloaded Lazell’s spectacular, classic monograph on the Lesser Antillean anoles, full of detailed descriptions, lovely illustrations (as above) and incisive commentary. Every digital library should have a copy, and so here’s your chance to get one easily, by clicking on this link. But note: the link apparently is only good for 30 days (and someone had to try it twice to get it to work, so be persistent). Also note: it’s a big file, so be patient as it downloads.

Enjoy! And after you look it over, write a nice comment for Skip, AA‘s all-time leading commenter, to read.

Expanding the Scope of Research on Island Anoles


Male Anolis nebulosus

Male Anolis nebulosus

With few exceptions, there has been far less research on the ecology and evolution of anoles inhabiting islands off Central and South America compared to anoles on islands in the West Indies. Siliceo-Cantero, Garcia, Reynolds, Pacheco and Lister (2016) have recently taken a step towards leveling the playing field by making a detailed comparison of a mainland A. nebulosus population residing in the Chamela-Cuixmala Biosphere Reserve in western Mexico, and a population inhabiting the small island of San Agustin in the Bay of Chamela just 5 km from the mainland study site. Their research focused on three central questions: (1) To what extent has the island population diverged morphologically, behaviorally, and genetically from the ancestral mainland population? (2) Does the morphology of the island and mainland populations correspond to any of the six West Indian ecomorphs?, and (3) In the absence of mainland competitors, has the island population undergone niche expansion and evolved towards a generalist phenotype?

Initial analyses of morphology indicated that both island and mainland populations were dimorphic, with each sex in each location having a large-headed, short-limbed morph, and a less common small-headed, long-limbed morph. The only other anole known to exhibit such intra-sexual dimorphism is Anolis agassizi from Mapelo Island, where there are large and small male morphs that also differ in coloration. In keeping with a pattern often found in anoles, island and mainland A. nebulosus morphs showed a significant positive correlation between average size-adjusted upper limb lengths and the mean logarithm of their perch diameters, suggesting that the morphs may be adapted to different microhabitats. Island morphs were also significantly larger than their mainland counterparts, and both the CV and Shannon diversity of the SVL distribution of all four morphs combined were significantly greater for the island population. The authors calculated the area of morphospace occupied by the morphs, as defined by the first two axes of a principal components analysis based on several morphological characters. On both island and mainland, the existence of a second morph doubled the total morphological space of each population. With respect to divergence in shape, mainland male and female morphs had significantly longer snouts and wider mandibles than the corresponding Island morphs. A PCA clearly separated island and mainland males from males of all the West Indian ecomorphs.

Female A. nebulosus

Female A. nebulosus

The genetic divergence of the island and mainland populations was assessed by sequencing both mitochondrial and nuclear genes. Genetic diversity of mtDNA was low on the island (haplotype diversity (h)= 0.50; nucleotide diversity (π) = 0.0007) relative to the mainland (h= 0.95; π= 0.006), and the populations were fairly divergent (Fixation Index = 0.34). Haplotype diversity of nuclear DNA, however, was somewhat higher on the island (h = 0.38 vs. .32). Based on 16,382 SNPs, island and mainland individuals were grouped cleanly by both Discriminant Analyses of Principal Components and STRUCTURE, a Bayesian clustering algorithm, and had 100% posterior support in STRUCTURE for membership in their respective populations. The authors conclude that these results indicate incomplete lineage sorting in mtDNA, as well as a relaxation population genetics model in which the island population is evolving independently of the mainland population under the influence of drift and lack of gene flow.

While the A. nebulosus population on San Agustin has undergone niche expansion in the absence of mainland competitors, there was no detectable evolution towards a generalist morphology, defined as a hypothetical phenotype intermediate between the shapes of the six West Indian ecomorphs. The authors suggest, however, that this definition is unrealistic given that the selective forces necessary to produce such a Jack-of-All-Trades ecomorph are most likely absent on the small islands harboring solitary Anolis populations. Alternatively, they propose that reduction in death rates, higher densities, increased intraspecific competition, and greater male-male competition for females are the major selective forces common to many small islands. A large body of theory and data indicate that all of these forces can drive the evolution of larger body sizes and greater SSD. The authors point out that Schoener’s work documenting wide-spread convergence in body size and SSD among solitary anoles in the West Indies, supports this hypothesis, and predict that the distributions of body size and SSD on single species continental islands should converge on those found in the West Indies (see Figure below).

A. Distribution of SSD indices for 102 Anolis species from the Greater Antilles. Dark grey bars delineate trunk-ground and trunk-crown ecomorphs. B. SSD distribution for 28 solitary West Indian anoles (data from Schoener, 1977). C. SSDs for 60 mainland species. D. Histogram of SSD for four solitary species including A. nebulosus, inhabiting islands off Central and South America (data for A. concolor and A. pinchoti from Calderon-Espinosa and Barragan-Forero, 2011. Data for A. agassizi from Lopez-Victoria et al., 2011). After Fig. 3 in Siliceo-Cantero et al, 2016.

A. Distribution of SSD indices for 102 Anolis species from the Greater Antilles. Dark grey bars delineate trunk-ground and trunk-crown ecomorphs. B. SSD distribution for 28 solitary West Indian anoles (data from Schoener, 1977). C. SSDs for 60 mainland species. D. Histogram of SSD for four solitary species including A. nebulosus, inhabiting islands off Central and South America (data for A. concolor and A. pinchoti from Calderon-Espinosa and Barragan-Forero, 2011. Data for A. agassizi from Lopez-Victoria et al., 2011). After Fig. 3 in Siliceo-Cantero et al, 2016.

Obama’s Historic Visit to Cuba: What about the Anoles?

George Gorman in the field

George Gorman, guru of all things Anolis, writes in:

49 years before Barack Obama’s historic visit to Cuba , I made a historic visit to Cuba but did not visit the Castro brothers, nor was there a baseball game played in my honor. I did, however catch a lot of Anolis,and send a letter to Science about my trip … which was published.”

Read it here.

Page 108 of 298

Powered by WordPress & Theme by Anders Norén