
Congrats to Jon Suh for this fabulous photo of Anolis grahami, native to Jamaica but introduced to Bermuda. It highlights the paper on ecological interactions among introduced anoles of Bermuda by Stroud et al.
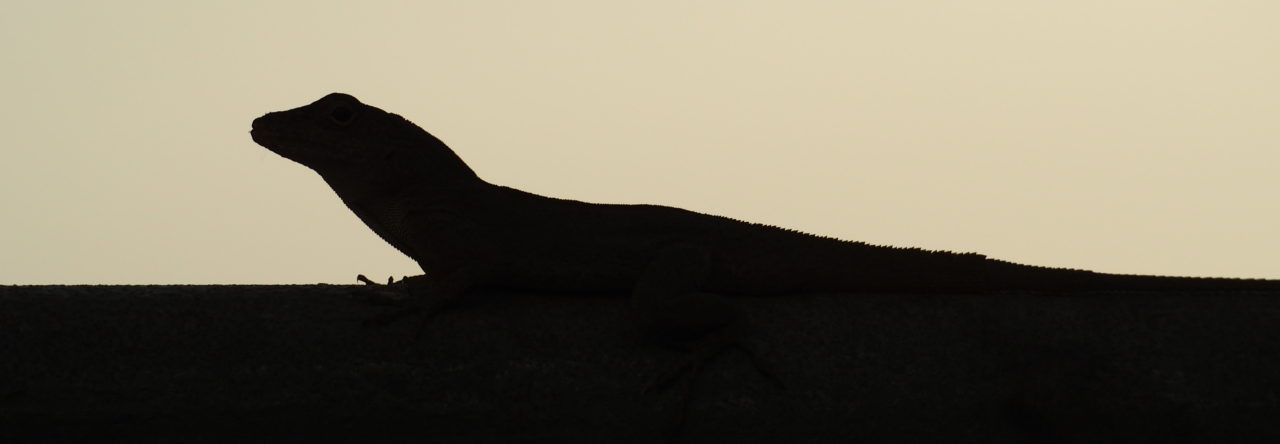

Congrats to Jon Suh for this fabulous photo of Anolis grahami, native to Jamaica but introduced to Bermuda. It highlights the paper on ecological interactions among introduced anoles of Bermuda by Stroud et al.
Dominica Geographic filed this report on Claire Dufour’s research on Anolis oculatus, which we have reported on previously.
Is the Zandoli Getting Stronger?
July 25, 2019 / No Comments

Dr. Claire Dufour is an ecologist and evolutionary biologist; a postdoctoral fellow of Harvard University, and currently a postdoctoral fellow and teacher at the University of Montpellier, in France. Claire is interested in the dynamic interactions between sister species and their environment. Her focus is on environmental pressures – such as competing or invasive species – on the evolution of ecological, morphological, and behavioural traits of animals such as insects, mammals and reptiles. This work has led her to take a scientific interest in the two competing species of anole (tree lizards) here in Dominica; one of which is the endemic zandoli (Anolis oculatus), the other, the invasive Puerto Rican anole (Anolis cristatellus).

For a number of years, Claire has been studying the co-existence of these two species in Dominica, how they react and behave towards each other, and how co-existing and dealing with extreme weather events such as hurricane Maria have affected behaviour and physical morphology. Her research has suggested a number of interesting outcomes that will require further study.
When the invasive species of anole arrived in the port area around Woodbridge Bay several years ago, its spread around the island was rapid, but it followed a pattern; namely the coastal road system. Claire and other scientists, such as Jacqui Eales who first recorded and studied the invasive species (see Dominica Traveller, second edition), speculate that this movement was probably caused by transportation in vehicles. The invasive anole hitched rides and occupied predominantly a coastal territory (and still does), whereas the endemic zandoli was also present in the interior where it had developed and spread over many, many years. At first, the relationship was feared to be antagonistic in nature, with the native zandoli coming under threat. Claire believes this has now changed and that the two species have settled into a form of coexistence. Moreover, she believes that the native zandoli is now doing better and is, in fact, probably the dominant species.

In order to study anoles, many environmental and morphological attributes are noted and recorded, most of which are too detailed and complex to get into here, but examples include: the location of the tree (or other structure) that the anole is inhabiting; where specifically on the tree the anole likes to hang out (trunk, branches, higher canopy, etc.); any behavioural characteristics (for example towards other anoles); and the physical attributes of the anole itself (size, weight, colour, etc.). A further experiment has been carried out to record behavioural characteristics that involves the innovative use of mimetic robots that are designed to represent both anole species. Claire presents the robots to the lizards and records their behaviour towards specific actions and signals that she is able to control remotely and unobtrusively.
Claire’s research has resulted in many interesting findings, one of which recently made headlines in the scientific community. Claire discovered that, with regard to the anoles she measured and recorded after hurricane Maria, their ability to grip with their toepads had increased by a factor of ten compared to her pre-hurricane tests. In concluding her work this year, Claire says that this attribute appears to have not only continued but has actually increased.
The likely, though unproven, explanation is that the anoles that survived the hurricane by clinging onto trees perhaps already had a strong grip compared to those that perished, and that they may have passed on this genetic trait as part of their morphological evolution. Further studies are needed and Dominica Geographic will follow Claire’s work.
Dominica is a draw for scientific researchers such as Claire because of its relatively unspoilt natural environment, its isolation as an island (it could be viewed as a very large laboratory), and its regionally and locally endemic species. One of the first things that Claire does when she comes here for her field work is engage with local people to get their views of what they have noticed about the two species of anole. Anecdotal evidence provided by local people is often an important foundation for further field research.

If you are interested in recording anoles or any other aspect of natural science in Dominica, here is one fun way to get started. Download the iNaturalist app to your smartphone and start photographing and recording the plants, flowers, birds and other critters you see when you are out walking (yes, you have to get out and explore !). Think about becoming a Dominica ‘citizen scientist’ and helping to record information about the island’s natural environment, and sharing your findings with the world.
Dominica ought to be producing more of its own scientists; encouraging, educating, and financially supporting young people with the interest and the potential. Many visiting researchers are very open to engaging and sharing their work with local people but often find it difficult to do so. More could be done to provide them with the facilities they need (classroom, lab, accommodation and so on); facilities that could also be used by a home-grown scientific community.

Interactions between native Anolis carolinensis (green anoles) and invasive Anolis sagrei (brown anoles) in the United States are discussed often here on Anole Annals. Most recently, this blog featured a local news broadcast from Louisiana and newspaper article from Florida, both of which describe a pattern that is repeated across the southern United States: When brown anoles invade a habitat, green anoles begin perching higher off the ground and thus become more difficult for anole enthusiasts to find.
Why do green anoles and brown anoles tend to occupy different perch heights in areas where they co-occur? By far the most popular explanation is that these species partition space as a means of partitioning resources, namely arthropod food. In simpler terms, they are competitors. But competition itself is not always simple. To better understand and study competition, biologists often classify competition as one of two types. Species can compete directly via aggressive encounters (termed “interference competition”) or indirectly through their shared use of a limited resource (termed “exploitative competition”). We know that green and brown anoles eat similar prey, suggesting that their competition is at least partly exploitative. Do they also engage in direct interference?
In a recently published paper in Oecologia, Katherine Culbertson (Harvard ESPP ‘18, former undergrad researcher in the Losos lab) and I tested the hypothesis that interference competition between native green anoles and invasive brown anoles occurs in the field. More specifically, we wondered if an asymmetry in interference competition might contribute to the vertical displacement of green anoles by brown anoles. To test for competitive asymmetries between the species, we used a classic method in behavioral ecology: tethered intruder trials. We presented adult male intruders to previously undisturbed focal individuals of the opposite species and videotaped the interactions. Intruders were tied around the waist with string at the end of a fishing pole with enough slack to move freely. We analyzed several aspects of the behavior of the focal lizards to evaluate asymmetries in interspecific aggression between the species: how often they attacked, how often they displayed (throat fan extensions, headbobs, and pushups), how often they retreated, and in what direction they retreated. (Disclaimer: Whenever an attack occurred, we ended the trial immediately so no lizards were harmed.)
As anticipated, we found that interference competition is asymmetric in favor of brown anoles, which are more likely to display and less likely to retreat from interactions than green anoles. In line with their arboreal tendencies, male green anoles also trend toward retreating upward more often than expected by chance. Somewhat surprisingly, these asymmetries are prevalent despite the almost complete absence of physical attacks (there were only two attacks in nearly one hundred trials, both by brown anoles). All told, our results suggest that signaling between the species and avoidance behavior by green anoles resolve most potential conflicts before they escalate to combat.

Many Floridians I’ve met in the course of my fieldwork have described brown anoles as bullies. Although anecdotal observations of animal behavior do not always reliably represent biological truths, in this case, the collective of observations made the residents I’ve spoken with are concordant with our data. Kudos to the many local naturalists who’ve shared their stories!
In closing, I’ll attempt to refine the metaphor of brown anoles as bullies, in acknowledgement that metaphors are often imperfect and with apologies to those who bristle at any attempt to anthropomorphize non-human animals. First, what makes a bully effective? On the playground, a bully might gain a reputation as such by initiating and winning a fight. Afterward, the mere threat of physical combat is often enough for the bully to exert his or her will on others. At our study sites, where green anoles and brown anoles have co-existed for several generations, brown anoles tend to dominate interactions with green anoles without attacking them. Perhaps physical combat is more common during the incipient stages of brown anole invasion, a hypothesis which could be tested by applying our methods across sites that vary in their invasion history.
Second, what’s the best way to deal with a bully? Many children learn to ignore bullies, a strategy rendered possible by the existence of alternative space to play or activities to engage in. Green anoles appear to find refuge in the canopy, where brown anoles seldom venture. Anecdotally, areas where no such canopy exists (i.e. areas with few plants or with only short, shrubby vegetation) are the areas where green anoles are most likely to disappear entirely following brown anole invasion. This hypothesis deserves a formal test.
Special thanks to the Aquatic Preserve Program run by the Florida Department of Environmental Protection for making this work possible. Check out the paper to learn more about our methods, results, and the implications of our findings.
Over on Biology of Mexican Herps, Levi Gray has started a new series where he examines some currently recognized Mexican Anolis to discuss whether, in fact, they are valid species. In the first installment, he discusses the case of Anolis utowanae. Check it out!
Simon Harris, a research student at the University of Gloucestershire, is seeking herpetologists to participate in a survey on the use of artificial hiding places (“refugia”).
Calling on anyone who has ever conducted a reptile survey!
My name is Simon Harris, I'm a research student @uniofglos conducting a survey on the use of artificial refugia in reptle surveying. Would greatly appreciate anybody filling it out.https://t.co/aFULHhm8th— SimonHarrisHerpetology (@SimonHarrisHer1) September 20, 2018
What he has in mind is the placement of artificial cover on the ground, under which reptiles might seek refuge. I’ve participated in such a study myself, using large plywood boards to sample Butler’s garter snakes (Thamnophis butleri) around Milwaukee, Wisconsin.
The method doesn’t seem that propitious for anoles. I can imagine artificial cover on walls or trees being a good technique for geckos– I’ve often surveyed house geckos using existing artificial objects (tapestries, paintings, etc.), but anoles, which were present at all sites surveyed, rarely turned up in a gecko survey. If anyone has ever used such a technique, or a similar one, for anoles, please tell us in the comments, and let us know how it worked. And, since many anologists have broader herpetological experience, if applicable, please fill out Simon’s survey!

Photo by Peter May (https://media.eurekalert.org/multimedia_prod/pub/web/191913_web.jpg?w=650)
A year ago, we mentioned reports of brown anoles (A. sagrei) in Germany, green anoles (A. carolinensis) in southern Spain and the Canary Islands (reviewed here), as well as a report of Cuban knight anoles (A. equestris) also on the Canary Islands, and asked if there were other sightings. Now we have one!
Reader Rick Wallach writes in:
PS – I should add that even if central Spain is too cold from late October – April to support a feral population of sagrei, southern coastal Spain from Isla Cristina, around the coast past Cadiz to Gibraltar and then back northward maybe halfway to Barcelona, is much warmer and would support them handily.
Just a thought.
Yet another newspaper article on brown anoles supplanting green anoles. This one from The Times of Apalachicola and Carabelle in Florida. The text of the article is reprinted below, but it contains maps and other figures that you’ll have to go to the original to see. Also, the article included the video above.
The Forgotten Coast is being invaded by an exotic lizard called the Cuban brown anole. This may not be a crisis unless you are a native green anole, in which case, raise the alarm because the newly-arrived brown anoles really are eating your young. And once invasive brown anoles are established, there is no way of removing them.
For the past 10 years, most of the anoles in local yards were the little green natives called Carolina anoles. They are not true chameleons, but some people call them that because they can change their color from brown to green. As every child knows, the males climb up tree trunks and flower stems and flash their rosy pink throat pouches, called dewlaps, to let females know they are interested.
But this year, green anoles have become scarce. Most of the anoles in my yard are now brown to black, with a light stripe down the back, and their throat pouch is bright orange rather than pink. Some of the males also have a raised crest from head to tail like a mini-dragon. Unlike Carolina anoles, brown anoles cannot change color, so no one will mistake them for chameleons.
When brown anoles appear, green anoles take to the treetops and become scarcer. Green anoles also adapt to their new situation by becoming even better tree climbers. Scientists have shown that the foot pads on green anoles become larger over time when brown anoles force them into tree canopies. This change is said to be a case of rapid genetic adaptation going on before our eyes.
Naturally, two similar species that are competing for food and territory will fight each other. Island resident Kimberly Alexis recently took a video of green and brown anoles fighting on a fence in her yard. Although the green lizard attacked the brown one, the brown anole quickly got a good bite on the green anole’s head. It surely would have won the contest if Kimberly had not broken up the fight. (See photo)
At first, I thought the brown anoles were merely green ones changing their color. Then a friend said, no, it is actually a different species that is creating havoc among the local lizards. It turns out that we humans accidentally imported the lizards with cargo coming from Cuba and the Bahama Islands. The brown anole first arrived on a ship that was unloaded on the Florida peninsula or the Keys around 1887 and began spreading north, (See map)
A map from 2004 that depicts the distribution of brown anoles does not show them in the Florida Panhandle, but not only are they in Franklin County, they are already on the barrier islands. Clearly, their range is expanding. How a land-loving lizard got to the barrier islands is anybody’s guess. One possibility is that they arrived as eggs in the roots of potted house plants.
Like a lot of other lizards in Florida, brown anoles are also kept as pets, and some of the feral population probably escaped into the wild. The Florida Fish and Wildlife Conservation Commission compiled a list of non-native reptiles that are now established in Florida, and they list 20 kinds of exotic anoles and their relatives that now live here.
The brown anole is hardly alone. Over 170 different reptiles have been introduced into Florida from imported cargo, from release of pets, or from zoos and research facilities after hurricanes. FWC lists 54 exotic reptiles that now have established breeding populations in the state, meaning that they have been present for 10 years. For example, Alexis mentioned that she also finds Mediterranean house geckos in her yard. Like most lizards, house geckos were brought here as pets but escaped and quickly became established.
The best known and most destructive escaped reptile in Florida is the Burmese python, which eats any native bird, mammal or even alligator it can wrap its coils around. Except for humans, mature alligators are the only animal large enough to return the favor and eat pythons.
I may be the last person in Franklin County to have noticed brown anoles, partly because there are many kinds of small lizards in the county. We have blue-tailed skinks, red skinks, Mediterranean house geckos, and legless Eastern glass lizards that many people mistake for snakes. Glass lizards have a checkered diamond pattern on their body that makes them look like a men’s tie, so my wife calls them “menswear lizards.”
From the standpoint of homeowners and gardeners, brown anoles are beneficial. Although they do eat the eggs of green anoles, they also eat flying insects, grasshoppers, spiders and even cockroaches. One can only hope that they will also dine on gnats and mosquitoes!
James Hargrove, a retired university professor who now lives on St. George Island, is a regular contributor to the Times on subjects of history and science. He can be reached at jhargrov@gmail.com
There have been lots of posts on the many great anole papers and posters at Evolution 2019, but here are a few of the non-scientific anole-related items from the meetings. First, a group of anolologists gathered at Trattoria Zooma on Federal Hill for lunch, where we feasted on Neapolitan specialties. Thanks to Nick Herrmann for picking the restaurant!
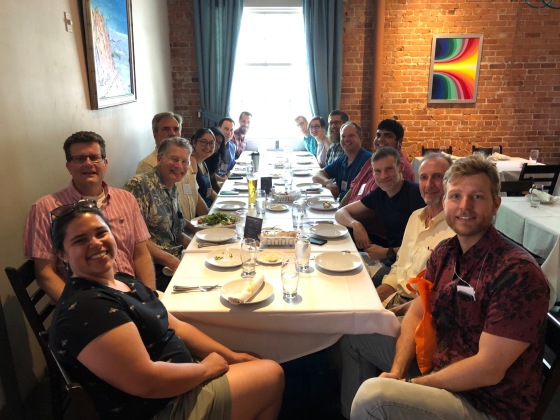
Anolologists gathered at Trattoria Zooma on Federal Hill, Providence, RI, for lunch on 24 June 2019.
Left side, front to back: Sofia Prado-Irwin, Todd Jackman, Jonathan Losos, Greg Mayer, Hannah Frank, Ambika Kamath, Ian Wang, Nick Herrmann. Right side, front to back: Ivan Prates, Chris Schneider, Liam Revell, Kevin AvilésRodriguez, Brian Langerhans, Jason Kolbe, Kristin Winchell, Emmanuel D’Agostino.
And, a closer look at Kristin Winchell’s absolutely fabulous Anolis lineatopus dress, which has already been noted.

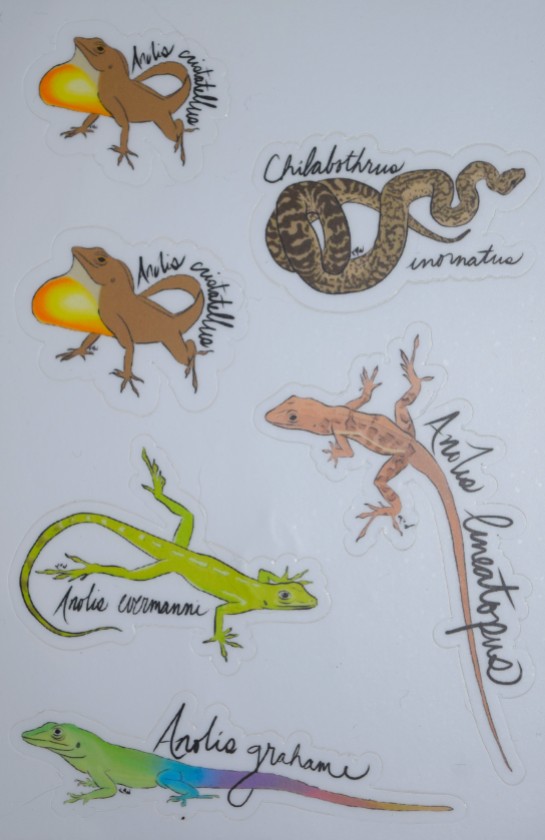
Kristin also produced a set of attractive anole (pus one boa) stickers, which she was handing out during her poster session.
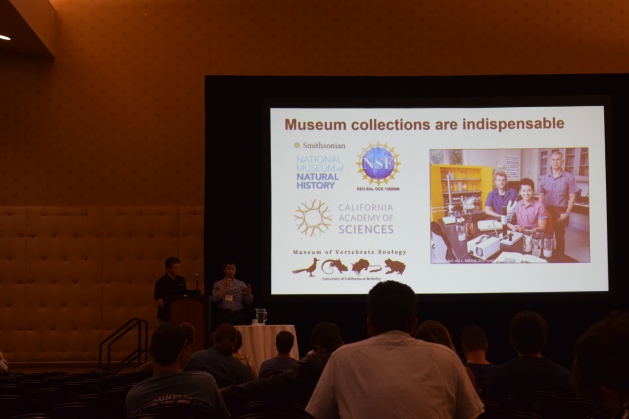
And finally, huge props to Jonathan Huie. He gave a nice talk on the ecomorphology of mainland anoles, but what I want to highlight here is that he did so under the most dire circumstances: not just afternoon of the last day, but his slides wouldn’t project! The modern equivalent of the old overturned slide carousel, Jonathan handled the absence of his visuals with aplomb, calmly opening his talk and introducing his topic before an empty screen, as technicians scurried to resuscitate the projection system.
When it seemed that the technicians would fail, I decided to document Jonathan’s admirable handling of the situation, but as I brought out and readied my camera, the slides finally appeared, so the photo below shows Jonathan with one of his slides. (Note the technician still at the podium, and that’s Ivan Prates and Kevin de Queiroz in the slide with Jonathan.) It was 5 minutes into his talk before the slides worked– an eternity for a 12 minute talk with 2 minutes for questions. Jonathan’s an undergraduate, but dealt with adversity like a pro!
The brown (a.k.a. “festive”) anole, A. sagrei, is slowly making its way around the world. Latest report: Panama City, Panama!
Powered by WordPress & Theme by Anders Norén