Elsewhere on Anole Annals, Silas Ginn responsed to a question about what shape anole eggs have. I believe his response deserves a wider audience and so am putting it up here as its own post:
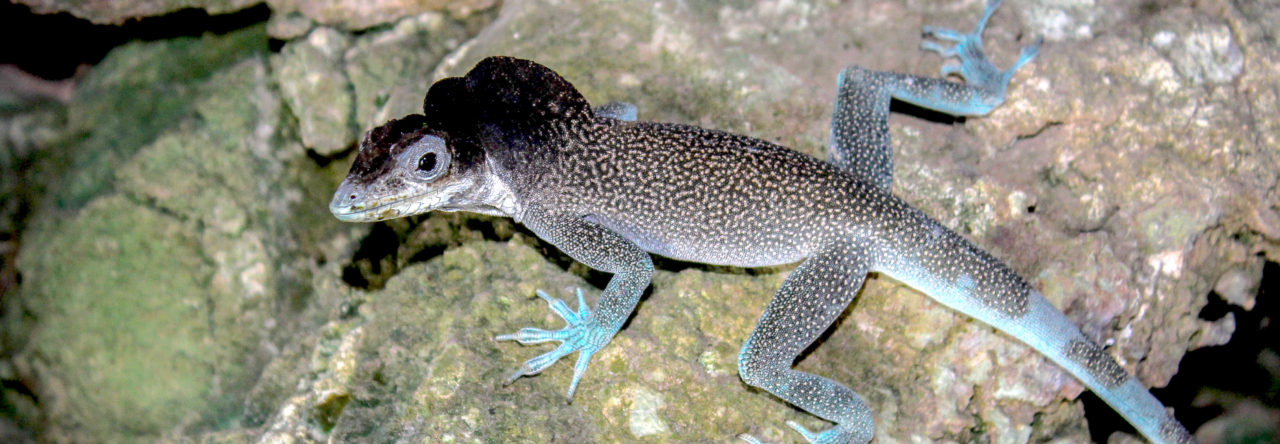
Indeed, anole eggs are long and skinny when they’re laid. But due to their leathery flexible skin, they can expand like a balloon and will grow with age and moisture. I’ve only got experience with Knight anoles, green anoles and probably four or five types of different brown anoles, but they’re all about the same – except that the Knight anoles HATCH at the same size as a green or brown anole.
As for hatchlings of green or browns, they’re so tiny it’s just remarkable! My old workplace was “infested” with a few species of geckoes (in Calgary Alberta, Canada – of all places!) and the baby geckoes popped up all over the place, especially in the filing cabinets where they obviously preferred to lay their eggs between pieces of paper, due to their being hidden & protected so well.
But yeah, at one point I brought in some house-plants – this was a huge ware-house complex where we ran an aquarium fish and reptile importer supplying Western Canada’s pet-shops, plus an outlet to the public, and a custom tank building shop in the back, quite a lot of space and amounting to more than 700 aquariums all told – and the whole place with 35-40ft ceilings and kept at upwards of 30-degrees Celcius all of the time, naturally humidity was such that it actually RAINED inside of the place on a regular basis – a problem in that it brought down the decades-old asbestos spray-on fire retardant insulation material from the ceilings – but we had some very nice sky-lights as well, if it had been kept up better it would’ve made a fantastic space well I mean really fantastic ’cause I loved it even WITH the dust and cockroaches ha-ha.
ANYWAY yeah I brought in some house-plants to liven the place up – should’ve left ’em when I moved on, ’cause they’ve all died since. There was a huge Munstera deliciosa “swiss-cheese plant” which I potted up on top of overhead wooden beams that had been there for decades, as some type of over-head system for a belt-driven power supply back when it was a SWEAT SHOP and then a SLAUGHTER HOUSE for chickens, yuck – we kept the beams for our water supply and oxygen for bagging fish, plus running heated/de-gassed tank-change water, and a master air-line gang-way for running hundreds of little valves off of for all of the little bubblers etc.
But yeah what I did with it MYSELF, was to support some house plants. And this one Munstera got HUGE – it sent out aerial roots, if you know Munstera you know the type I mean – but THESE ones got long enough that not only did they hang down the nine-ten feet to drink from a puddle on the ground beneath it (how did it know there was a puddle there?) which pooled on the polished concrete floor, from leaking tanks, over-spills from the automated tank over-flow water-change system (tanks were individual, and what looked like the typical system where everything’s on a loop, was simply a fill line from huge tanks in the back, run with big pumps only during water changes, and the over-flow went directly to the drains. Which were typically blocked up and one such drain which had been permanently blocked by our swimming-pool canister type “Sand-Filter” from our Koi pond system (several ponds ganged together on one filter) had a huge cray-fish living at the bottom of it, as though the building itself were a concrete island with a lake or ocean below it, and drain pipes more like tunnels carved by urchins or other such burrowing creatures … such was the ecosystem of the place!)
Anyway yeah, that Munstera plant threw out aerial roots that first reached the puddle on the floor, but then I began to wrap ’em around the wooden beams to keep ’em out of the way, and they kept growing down and down – once they’d got a taste of the mineral-rich water down at the bottom there was no stopping ’em! And I kept looping ’em over and over, they kept growing until this became a semi-daily task, where the roots would grow more than ten inches in one night! INSANE house-plants.
But the best of ’em all, was a 30ft Ficus tree. I had been keeping my Knight anoles in ficus trees from the very beginning, and they’d laid their eggs in the pot at the bottom, whereupon they hatched out better than any other time when I tried to incubate ’em artificially.
Read More