New Paper: Disentangling Controls on Animal Abundance: Prey Availability, Thermal Habitat, and Microhabitat Structure
DOI: https://doi.org/10.1002/ece3.7930

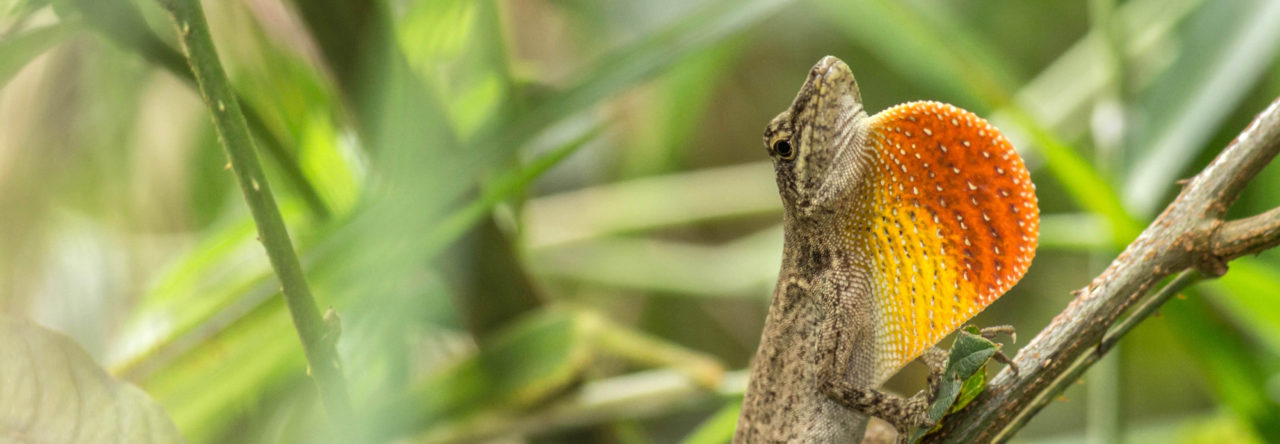
Above: Male Anolis bicaorum, endemic to the island of Utila (photo credit Tom Brown).
Why are there more anoles in this plot? This is the question that we continually asked ourselves whilst setting up our 2018 survey plots on the small island of Utila, Honduras, home of the endemic Anolis bicaorum (pictured above). So in 2019 we set out from Heathrow airport, kitted up with A LOT of equipment, for our second field season, based at Kanahau Utila Research and Conservation Facility, with one of the goals being to look into just that (see previous Anole Annals posts on Utila and its anoles).

Above Left: Getting ready to leave Heathrow (photo: Adam Algar). Above Right: Miraculously all the field kit all safely arrived at Houston stopover.
We all know that such factors as the thermal environment, prey resources and structural habitat play important roles in the lives of our beloved anoles. And we also know that you can go to one spot and be overrun with anoles, but go to a seemingly similar spot nearby and find none (usually when the field season is drawing to a close and you still don’t have a large enough sample size). But how are these aspects of anole biology linked? Specifically what determines their abundance, and its variation, at fine scales? While ecological niche theory is well developed, empirical evidence for which factors are most important, and how they interact, is still rare for many taxa, including anoles. Given rapid environmental change, understanding the drivers and mechanisms governing abundance is now more important than ever.
We measured the abundance of the endemic Anolis bicaorum across thirteen 20x20m plots along a tropical habitat gradient, using standard mark-recapture methods, based on Heckel & Roughgarden (1979). Within these plots, we also measured factors relating to the thermal habitat suitability (using 3D printed models fitted with iButtons), structural habitat (perch surveys), canopy cover (leaf area index) and prey availability (arthropod biomass and diversity). We then used N-mixture models and path analysis to disentangle direct and indirect effects of these factors on anole abundance.

Above Left: Emma setting up 3D printed anole thermal models. Above Right: Tom out collecting 3D printed anole replica models (photo credits Adam Algar).
We first decided on several measures for each niche factor which could determine the suitability of the habitat for the anoles. For the thermal environment, we first determined the thermal preference (Tpref) range of A. bicaorum, following Battles and Kolbe (2018). We then calculated two indices to quantify the thermal habitat quality of each plot. The first was the percent of model hours that operative temperatures (from 3D models) were within the Tpref range over the 36-hour study period for each plot. The second was the total number of degrees (°C) that the models deviated from the Tpref range across all models throughout the survey period for each plot, which included the total degrees, the degrees above and degrees below the Tpref range.

Above: Many of the anoles were “side-eye” pros
As a measure of structural microhabitat quality we determined both perch availability by counting surveys and the plot basal area (a measure of stand density), across all tree trunks, palm stems and fence posts in the plot.

Above: A. bicaorum predating on an unidentified spider (Araneae).
For prey availability, we measured arthropod biomass (g) and diversity (Simpson and Shannon’s) from a combination of leaf litter sieving and sweep-net samples taken in each plot. Sweep-net and leaf-litter samples were combined for plot level analyses.
We also measured mean leaf area index (LAI) in each plot using an Accupar LP80 ceptometer. LAI is the one-sided area of leaves per unit ground area and is a measure of canopy density; it is expected to influence thermal environment via the interception of solar radiation (Campbell & Normal 1998; Algar et al 2018).
After we determined reasonable measures of habitat suitability for each factor, we examined univariate relationships between A. bicaorum abundance and each of our habitat variables (percent of time within Tpref, deviation from Tpref, perch number, basal area, arthropod biomass, arthropod diversity and LAI) by including each predictor as a covariate in a multinomial-Poisson mixture model of abundance. The results of the most significant and strongest relationships can be seen in the figure below.

Above: Relationships between Anolis bicaorum abundance and individual niche metrics in forest plots across Utila, Honduras. Relationships were estimated using multinomial Poisson mixture models with a constant detection rate across plots. All variables are scaled to a mean of zero and unit variance; (a) reflects thermal habitat quality, (b) reflects structural habitat quality, (c) reflects prey availability and (d) reflects canopy cover.
We used these models to select a subset of these variables (one representing habitat structure, one prey availability, and one thermal quality) for subsequent path analysis; we also included LAI as the sole measure for canopy cover. We used the path analysis to evaluate the relative strength of direct and indirect effects on abundance. As we could not estimate indirect paths within a single multinomial-Poisson mixture model, we estimated abundance for the path analysis from a multinomial Poisson mixture model that included no environmental covariates, held detection rate constant, and permitted abundance to vary by plot. The results of the path analysis can be seen in the figure below.

Above: Direct and indirect effects of niche axes on A. bicaorum abundance. (a) Values are standardized path coefficients; line width is proportional to the strength of the effect, solid lines indicate statistically significant pathways. ε, unexplained variation. (b) The total effects of covariates on abundance. NP: number of perches; PB: prey biomass; LAI: mean leaf area index; TP: time within Tpref range.
Our results showed that thermal habitat quality and prey biomass both had positive direct effects on anole abundance. However, thermal habitat quality also influenced prey biomass, leading to a strong indirect effect on abundance. Thermal habitat quality was primarily a function of canopy density, measured as leaf area index (LAI). Despite having little direct effect on abundance, LAI had a strong overall effect mediated by thermal quality and prey biomass.
We have demonstrated the interconnectedness of abiotic and biotic components that determine habitat quality and animal abundance. Rather than identify a single strong control on abundance, we found key abiotic factors (canopy cover and thermal environment) affect abundance through multiple pathways and have effects that are mediated by biotic interactions and the niche of the focal species. In particular, our results suggest alignment of thermal niches across multiple trophic levels results in strong indirect effects of thermal environment on anole abundance. Losses of thermal habitat quality, particularly due to canopy loss, may thus have greater effects than appreciated when only direct effects are considered.
Our results demonstrate the role of multidimensional environments and niche interactions in determining animal abundance and highlight the need to consider interactions between thermal niches and trophic interactions to understand variation in abundance, rather than focusing solely on changes in the physical environment. Identifying the factors responsible for population change along habitat gradients will improve our understanding of how multidimensional environments and niches interact to determine population abundance. Which is more important than ever in this ever-changing world.
You can read the full paper here.
If you have any questions or just an interest in the work, please feel free to contact me emma.a.higgins@hotmail.com.
I would also just like to thank everyone again who was involved in this project, it was a lot of hard work, but great fun and it couldn’t have been done without the team effort.

Above: Part of the field team, helping process what is certainly not an anole, whilst setting up survey plots (photo credit Adam Algar).
References
Algar, A.C. et al. 2018. Remote sensing restores predictability of ectotherm body temperature in the world’s forests. – Glob. Ecol. Biogeogr. 27: 1412-1425. https://doi.org/10.1111/geb.12811
Campbell, G. S., and J. M. Norman. 1998. An introduction to environmental biophysics. 2nd edition. -Springer-Verlag, New York.
Battles, A.C. and Kolbe, J.J. 2018. Miami heat: Urban heat islands influence the thermal suitability of habitats for ectotherms. – Glob. Change Biol. 25: 562–576. https://doi.org/10.1111/gcb.14509
Heckel, D.G. and Roughgarden, J., 1979. A Technique For estimating the Size of Lizard Populations .Published by : Wiley on behalf of the Ecological Society of America Stable URL : http://www.jstor.org/stable/1936865 References Linked refere 60, 966–975.


